KPIs indicate if things are going well. A sudden change in the KPI should create an alert and call for further analysis like segmentation. A spike or decline must indicate that there is a problem (or an opportunity) and spur “diagnostic mode” to find the cause. A metric that fluctuates constantly, without concern, or a stable metric that never changes – those are not KPIs. If a metric is wholly dependent upon market forces, it is not a KPI. If a metric is out of your company’s control, it is not a KPI.
For example:
- Overall Organization: EBITDA / Revenue / Free Cash Flow
- Digital Organization: Online Channel Revenue / Online Revenue Mix / Online Channel Cost of Sale
- Digital Manager: Cost of Acquisition / Conversion Rate / Revenue by Product
- Digital Lead: Landing Page & Campaign Performance / Conversion by Desktop vs. Mobile”
- Number 1 way to getting actionable KPIs is starting with the end objective in mind and backing out what metrics accomplish this from there. an actionable KPI is a revenue-centric metric (or metrics) with a clearly defined target. With the ability to state where “success” is, the KPI has context and becomes actionable. Without a target, whatever you’re measuring is not an indicator but rather it is simply a metric. If you can take action based on the metric value or observing a change in the metric over time then this is a prime quality of a KPI. If a metric is not actionable, then it’s not a KPI. It might still be useful to the business in some way but if there is no action to be taken, there is no opportunity for optimisation – the number has less value to the business as it doesn’t drive change and we’re all about change, right?
- Work closely with the management and leadership teams of the organization to make sure there is good agreement on what is being measured and how it impacts the business. The closer the connection between an individual marketing KPI and a financial performance variable (e.g., revenue), the more useful it is for business managers who aren’t immersed in analytics and metrics on a day-to-day basis. Indirect KPIs can also be very useful if their connections to business goals are clear. When there is good executive-level support for the chosen KPIs, it’s much easier to secure budget and other resources for the “actionable” part: creating and adjusting campaigns, creating and modifying marketing content, adding new systems and support roles, etc. This approach also helps prevent “KPI Overkill” by limiting the key metrics to just those that are truly important to the business and the management team. The analyst team will always want to look at lower levels of detail, of course. But just because some of the sub-metrics are interesting and useful to analysts does not mean they should be included as KPIs.
- The contextual piece comes from segmenting your KPIs. For example – knowing your revenue per visitor has increased is great but knowing it was driven by new customers who clicked on a specific paid search keyword is better! The knowledge gained from this may allow you to alter bid strategies and thus take action on a change in your KPI.
- Once you’ve aligned the KPIs throughout the business, ensure everyone knows who has what KPIs and what can be done to affect them. This ensures accountability which helps drive action and results. The final issue to avoid is setting KPIs that are very hard to have any impact or control over, this makes them a lot less actionable and they do not provide any motivation to the team to drive things forward.
- Each KPI should have a target that you are attempting to reach, such as a 5% increase in sales for a particular product.
- Creating effective KPIs starts with defining the business questions that need to be informed by KPIs. It sounds so obvious, but in practice, it’s not. I’m not talking about a simple question that can be answered with data, like “what’s our weighted bounce rate by landing page by channel?” That’s not a business question. I’m talking about creating a question that drives the eventual analysis and outcome and, when answered, can help people make a decision that improves business performance. For example, “Which landing pages should we continue to use and why?” is a more helpful business question.
- I have been in several analytics meetings where a KPI like average time on page is thrown up on a screen, but the audience has no idea if 50 seconds is a good or a bad time for how long someone is spending on a page. For an analyst to truly add value, he needs to use KPIs that he can speak intelligently to their performance and be able to further derive actionable insight from that KPI. Without a goal or forecast to compare against, the analyst is essentially driving blind and using his or her gut reaction to speak to business success or failure. If you can’t get your hands on a goal or forecast, either find benchmark data from similar websites in your industry (IBM, Adobe and Google all have benchmark features you can take advantage of) or choose a new set of KPIs.”
- There is no value in having any KPI if it is not segmented by your main audiences, personas, etc. When you use segmentation right, even the plainest KPIs (bounce rate, subscription rate, Ecommerce Conversion %) will become useful. Great segments to start with are: New vs. Returning, Acquisition Channel / Campaign, and Device Category.
- Dimension Swapping: By this, I just mean evaluating your KPIs against different dimensions and dimension combinations. If you’re using Google Analytics, access the Mobile Overview report. Surprised to see how few visitors are submitting leads on smartphones? Don’t assume that this low conversion rate is endemic to smartphones; instead, apply Operating System as a secondary dimension. You might be even further surprised to see that your CR is much lower on iPhone than Android, but you’ve started to construct a meaningful story, and you can dig further by checking conversion rate for specific devices in the Mobile Devices report and applying Screen Resolution as the primary dimension in the Browser & OS report.
- Constituencies: Create segments that map to your audience constituencies, and always evaluate your KPIs within these segments. If you run a job freelancing site or app, evaluate your “post a job” goal only for those audience members who are there to post a job. How do you create the segment? Often, it’s a user’s own behavior that indicates the constituency: users who access the “post a job” page or screen are telling you the constituency they belong to, and you can create a “behavioral” segment accordingly. Now you’ll be able to see that the conversion rate for this goal within the relevant segment is 5% instead of 1%, and that overall conversions are 50% higher than this time last year, not 10%. It’s the segmentation that facilitates the insight and prompts further analysis and action for optimization and ROI.”
How to define KPIs
- Ask the client, how do they define their KPIs and why did they select those particular KPIs. The goal here is to first understand their perspective, their reasoning and get an insight on why things are the way they are and not jump to any conclusion or start making recommendations.
- I truly believe that my client knows a lot more about their industry and target market than I ever will. And I am here to help and not to dictate them how to run their business.
- I use my client’s years of knowledge and experience to fuel and speed up my analysis. I ask tons of questions. I keep asking questions until my client is no longer able to answer. When the client is no longer able to answer, then I start my own research to get answers to those unanswered questions, because then my analysis really matter. There is no point in spending hours and days, digging out information and insight that are already known to your client.
- Once I have acquired all the knowledge I can, from the client then I match my client’s understanding about their business with my own understanding of their business, to determine “gaps”. These gaps are the conversion issues and my goals to fix. Once I have identified the conversion issues, then I determine whether the client’s chosen KPIs are a best fit to measure the performance of these goals. It is a long process. KPIs are often the result of weeks or even months of analysis and research. It is not something which can be delivered on day 1.”
- My #1 strategy for defining actionable KPIs is to get with the business owner and understand what they really care about. Are they interested in growth or sustainability? Are they interested in profit or market share? Once we really understand what people are looking for in their business, you start to brainstorm Key Performance Indicators that they can use to measure the most important items. Then comes the fun part – what I call the four T’s of analytics. After establishing KPIs, you need to get aligned with your targets, tactics, teams and tools. In that exact order. Set targets around these KPIs that the business agrees with. Pull in tactics that can provide proven results that hit targets. Build a team and accountability for the people running the process. And last, evaluate tools that you can use to measure target performance. Add it all together and you have not only defined actionable KPIs, you have defined a plan that is aligned with the goals of the business executives and their marketing and analytics functions. Anything else would be uncivilized.” 🙂
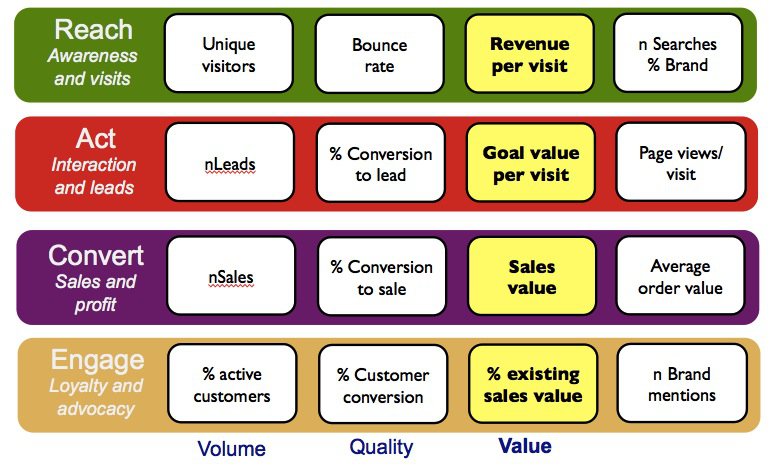
Example of KPI
In my opinion the number one strategy to define and choose your actionable KPIs is linked to two main questions every analyst and digital manager (in every digital niche) should ask before starting any digital project and investment.
#1 Question, the most important, is “Why?”: WHY am I doing this PPC campaign, WHY am I posting on Facebook, WHY have I built this website?
When you ask WHY, you’re forcing yourself to write down some objectives and goals. Try to transform the WHY answers from text to numbers: WHY am I posting on Facebook? ANSWER: I want to start a new conversation with my students to increase their knowledge and I want to create relationships with them that last longer than their university career —> This is a long and comprehensive text answer, now transform it in numbers —> I want to receive an average of 25 comments on every post from my students and I want at least 10 unique students commenting on my post. Now I like it!
So in this case I should use as KPIs #comments per post and #unique answers per post.
#2 Question: may I influence the KPIs I’ve fixed with Question #1? If you sell ice-creams you like hot and sunny days and you don’t like when it’s raining with 4°C: you know you will sell less ice creams that day, but you can’t influence the weather (not for the moment at least), so weather conditions will never be “actionable”.
In digital many times we can influence our KPIs. In this case you’ve found “Actionable KPIs”: in the example above: if I send a newsletter to the students with the link to the Facebook posts we can improve # of comments and # of people engaged. If I publish an abstract of the FB post in the University Intranet Learning Platform I can change those numbers.
many clients tell me that their objective is “To increase sales”. The problem with such an objective is that I have no clue what to do next. Should I just increase Adwords budget and hope to sell more? I don’t have context either. What does it mean to “increase sales”? When is it enough? It is very difficult to start thinking of actions if I don’t know what I want to achieve.
So I ask the client to change the way the objective is described. For instance, we might rephrase it as “Increase monthly sales by 10% compared to previous year, focusing on average order value”. Hence, I know that I need to measure two KPIs: monthly sales and average order value (AOV). I also have a target for each KPI: last year’s monthly sales and AOV. Therefore, I know what I want to change, and where I want to get. And this is to me an actionable KPI, forcing you to go from A to B.”
The very first question usually is: what should the visitors do on our website and how much money do these actions produce for the company? This is the final step of the conversion path.
I tend to ask from clients: what is the most important element on your website, home page or landing page, that visitors should click?
When you tag and measure that element, you are able to create a segment of visitors who clicked and evaluate if those visitors converted better than those visitors who didn’t click.
This is the first step of conversion path analysis and an important step towards conversion rate analysis. In addition to the click data, qualitative data (like heatmaps) is very useful for getting insights. With quantitative and qualitative data, you should easily get new testing ideas for the page.”
My number one strategy is as follows:
- Identify the business outcome that is to be measured. (e.g. total profit)
- Identify and rank all the possible influences on this (e.g. cost of goods sold, customer acquisition cost, etc)
- Identify the top influencing factors that you can control.
- Use statistical tools to identify if there is a relationship between these and the business outcome. (e.g. correlation matrix, regression analysis, etc)
- Pick the most important ones that are both controllable and have a relationship.
- Document the actions that can be taken if the KPI changes.
If you can’t control it and there isn’t a strong relationship then it is probably not worth treating as a KPI.”
Leave a Reply